01
Tek bir varlığın durumu net değildir
Konumun hangi tehlikelere maruz kaldığını ve yapının özelliklerinin bu durumu nasıl etkilediğini tek bir görünümde anlamak kolay değildir.
 RISK INTELLIGENCE
Konum Bazlı Fiziksel Risk Analitiği
Tek bir yapıdan, binlerce yapıyı içeren bir portföye; deprem, su baskını ve heyelan risklerini konum, çevresel veri ve yapı özellikleriyle birlikte değerlendirin.
₺250’den başlayan fiyatlarla dakikalar içinde.
Risk Özeti
Deprem
72/100
Heyelan
38/100
Su Baskını
24/100
Yapı Özeti
Betonarme · Çerçeve · 6 kat
Konut · 2000 sonrası
Fiziksel Riski Karara Dönüştürmek
Deprem, heyelan ve su baskınına ilişkin veriler tek başına yeterli değildir. Konum, yapı özellikleri ve çevresel koşullar birlikte değerlendirilmeden bir varlığın fiziksel risk profili netleşmez. Çoklu lokasyonlarda ise riskin nerede yoğunlaştığını ve hangi varlıklara öncelik verilmesi gerektiğini görmek daha da zorlaşır.
PerilX, fiziksel riski tek bir yapıdan tüm portföye kadar görünür, karşılaştırılabilir ve karar süreçlerinde kullanılabilir hale getirir.
01
Konumun hangi tehlikelere maruz kaldığını ve yapının özelliklerinin bu durumu nasıl etkilediğini tek bir görünümde anlamak kolay değildir.
02
Farklı konumlar ve yapılar ortak bir yöntem ve tutarlı göstergeler üzerinden değerlendirilmediğinde sağlıklı bir karşılaştırma zemini oluşmaz.
03
Çok sayıda lokasyonda riskin nerede yoğunlaştığını, hangi varlıkların daha fazla dikkat gerektirdiğini ve kaynakların önce nereye yönlendirilmesi gerektiğini görmek kolay değildir.
Nasıl Çalışır
PerilX, konum ve yapı bilgilerini birlikte okuyarak deprem, heyelan ve su baskını risklerini ayrı ayrı değerlendirir; sonucu anlaşılır bir fiziksel risk profili olarak sunar.
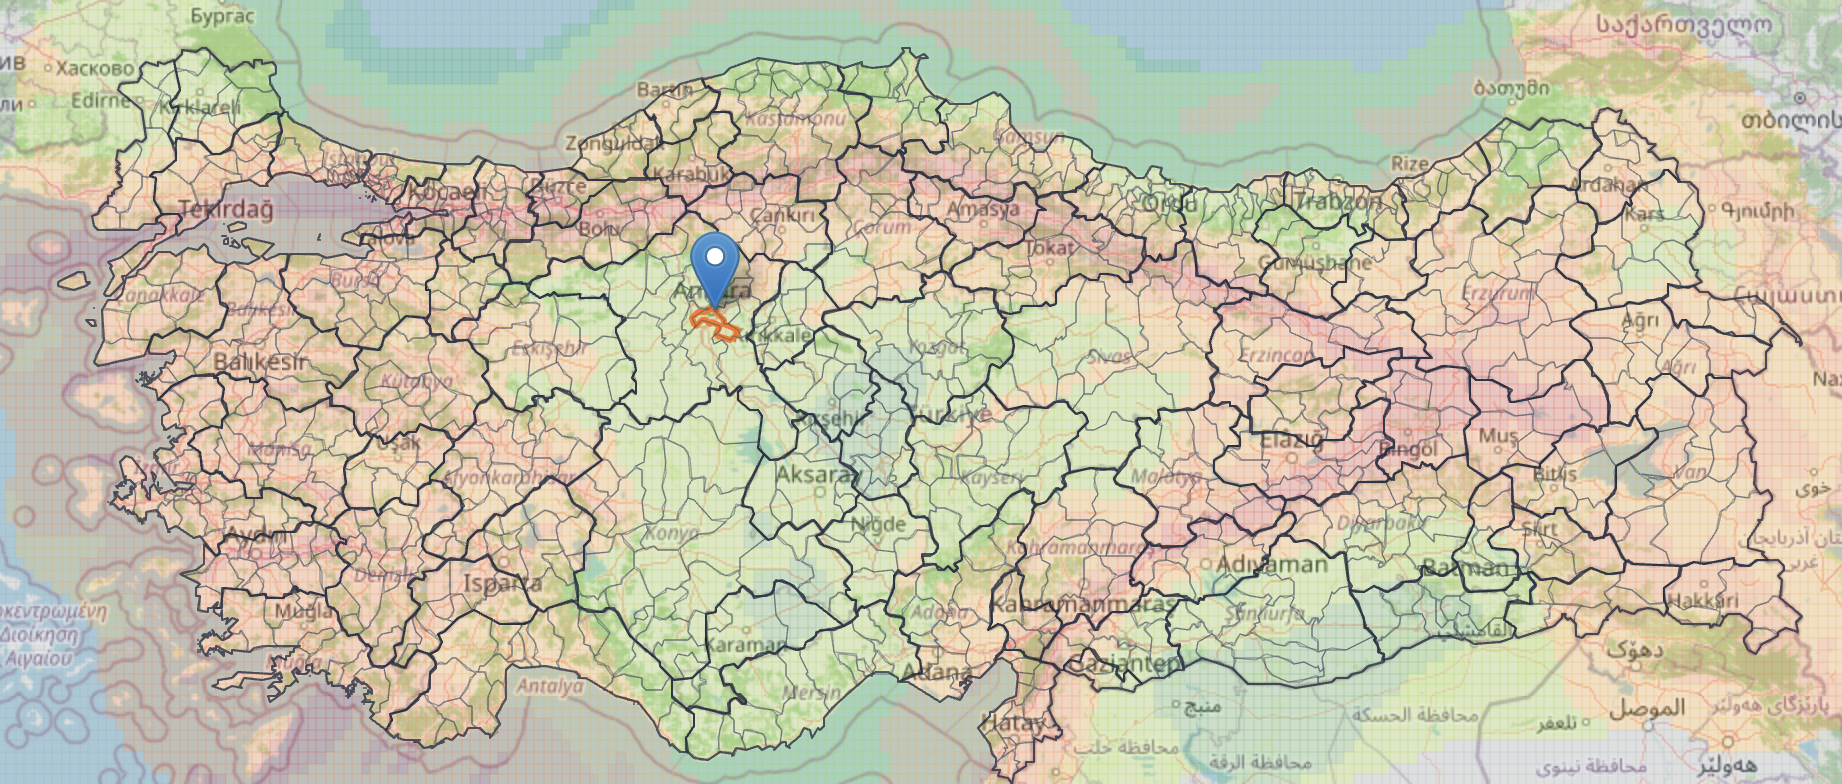
Analiz etmek istediğiniz konum için deprem, heyelan, su baskını ve zemin bağlamı otomatik olarak okunur.
Yapı tipi, dönem, kat sayısı ve kullanım gibi girdiler fiziksel risk taramasını bağlamsal hale getirir.
Sonuçlar ayrı tehlike skorları, veri güveni ve yorumlarla birlikte görünür; karar süreci daha okunabilir hale gelir.
Örnek Çıktı
Tek bir yapı için fiziksel risk profilini, çoklu lokasyon için ise portföy dağılımını ve önceliklendirme görünümünü aynı karar destek mantığıyla inceleyin.
Bu bölüm temsili örnek veri ile oluşturulmuştur.
Tekil Analiz
Yapı bilgisi ve tehlike katmanları birlikte okunur.
Temsili Önizleme
Risk Özeti
Deprem
41/100
Orta
Heyelan
18/100
Çok Hafif
Su Baskını
67/100
Orta
Profil
Yapı profili
Düşük katlı konut
Yapı tipi
Betonarme çerçeve
Kat sayısı
4 kat
Yapım dönemi
2000 sonrası
Baskın sinyal
Su baskını
Karar çıktısı
Öncelikli inceleme
Portföy Analizi
Varlıklar ortak göstergelerle karşılaştırılır.
128
Lokasyon
23
Öncelikli kayıt
3
Tehlike katmanı
Tehlike Bazlı Dağılım
Portföy Hasar Oranı
İstanbul / Ataşehir
Konut
78/100
İzmir / Bornova
Konut
64/100
Bursa / Nilüfer
Konut
57/100
Kullanım Alanları
PerilX, tek bir yapıdan çoklu lokasyon ve portföy ölçeğine kadar farklı karar süreçlerini destekler.
Portföyünüzdeki gayrimenkulleri fiziksel risk görünürlüğüyle değerlendirin.
İncele
Saha öncesi konum bazlı risk sinyallerini görün.
İncele
Portföyünüz için ön değerlendirme ve risk tarama katmanı oluşturun.
İncele
Şube, tesis ve varlık lokasyonlarınızı önceliklendirin.
İncele
Karar vermeden önce konumun fiziksel risk profilini inceleyin.
İncele
Fiziksel Riski Görünür Hale Getirin
Bir yapının fiziksel risk profilini inceleyin veya çoklu lokasyonlarda risk dağılımını karşılaştırarak önceliklerinizi belirleyin.
Daha detaylı çerçeve için metodoloji sayfasını inceleyebilirsiniz.
PerilX çıktıları karar destek ve ön değerlendirme amacı taşır; resmi ekspertiz, mühendislik incelemesi, sigorta fiyatlaması veya yasal rapor yerine geçmez.